The state of regional forests and water resources received a ‘D’ average in the recently published 2018 Toronto and Region Conservation Authority (TRCA) jurisdiction watershed report card. The ‘D’ grade tells us that Toronto area ecosystems continue to be stressed — and that urbanization is the main reason for this stress.
Is this bad news? It depends on your outlook. Are you an optimist or a pessimist? This ‘D’ average is the same grade TRCA received when the first round of Conservation Authority report cards was published five years ago. You could interpret this unchanging grade to mean that the health of TRCA watersheds and waterfront is not improving — or you could interpret it to mean the situation is not getting worse.
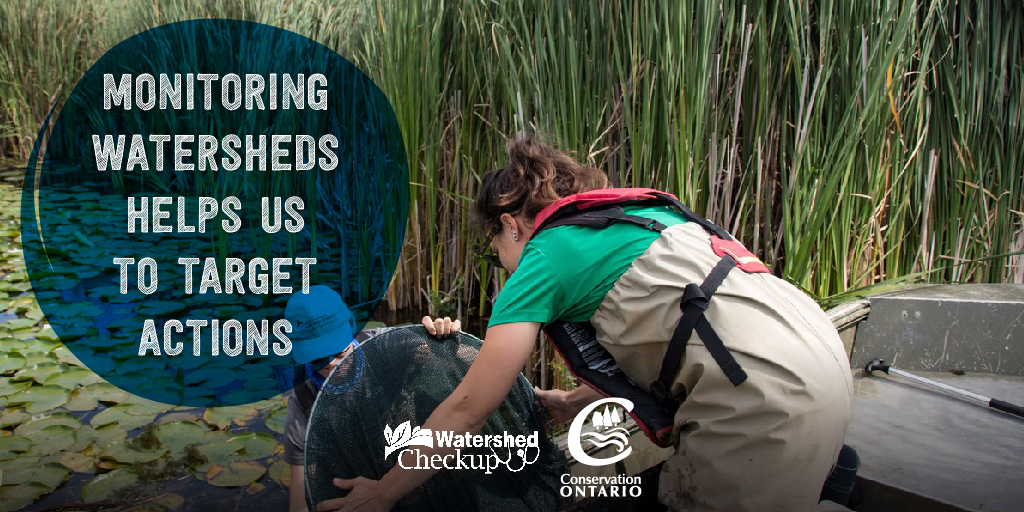
Or if you are a data analyst with TRCA’s Environmental Monitoring team, you would know that five years is a relatively short period of time to be able to measure change. Uncovering statistically significant trends requires robust datasets containing lots of data — the longer the better. That is why TRCA has made the commitment to long-term monitoring at fixed stations throughout the Toronto region.
The Role of Environmental Monitoring
For more than 15 years, TRCA has been tracking the health of nine river watersheds through the Regional Watershed Monitoring Program (RWMP), which conducts assessments of fish habitat and communities, breeding birds and amphibians, vegetation communities, water quality, and benthic macroinvertebrate communities. The surface water indicator was based on the data from the RWMP: 36 water quality stations and 135 benthic macroinvertebrate monitoring stations.
TRCA also monitors fish habitat and communities along the waterfront in our jurisdiction, and has been doing so for more than 35 years in support of the Toronto & Region Remedial Action Plan. The biodiversity indicators used in the 2018 Lake Ontario Waterfront Report Card came largely from these data collection efforts.
Long-Term Data Findings
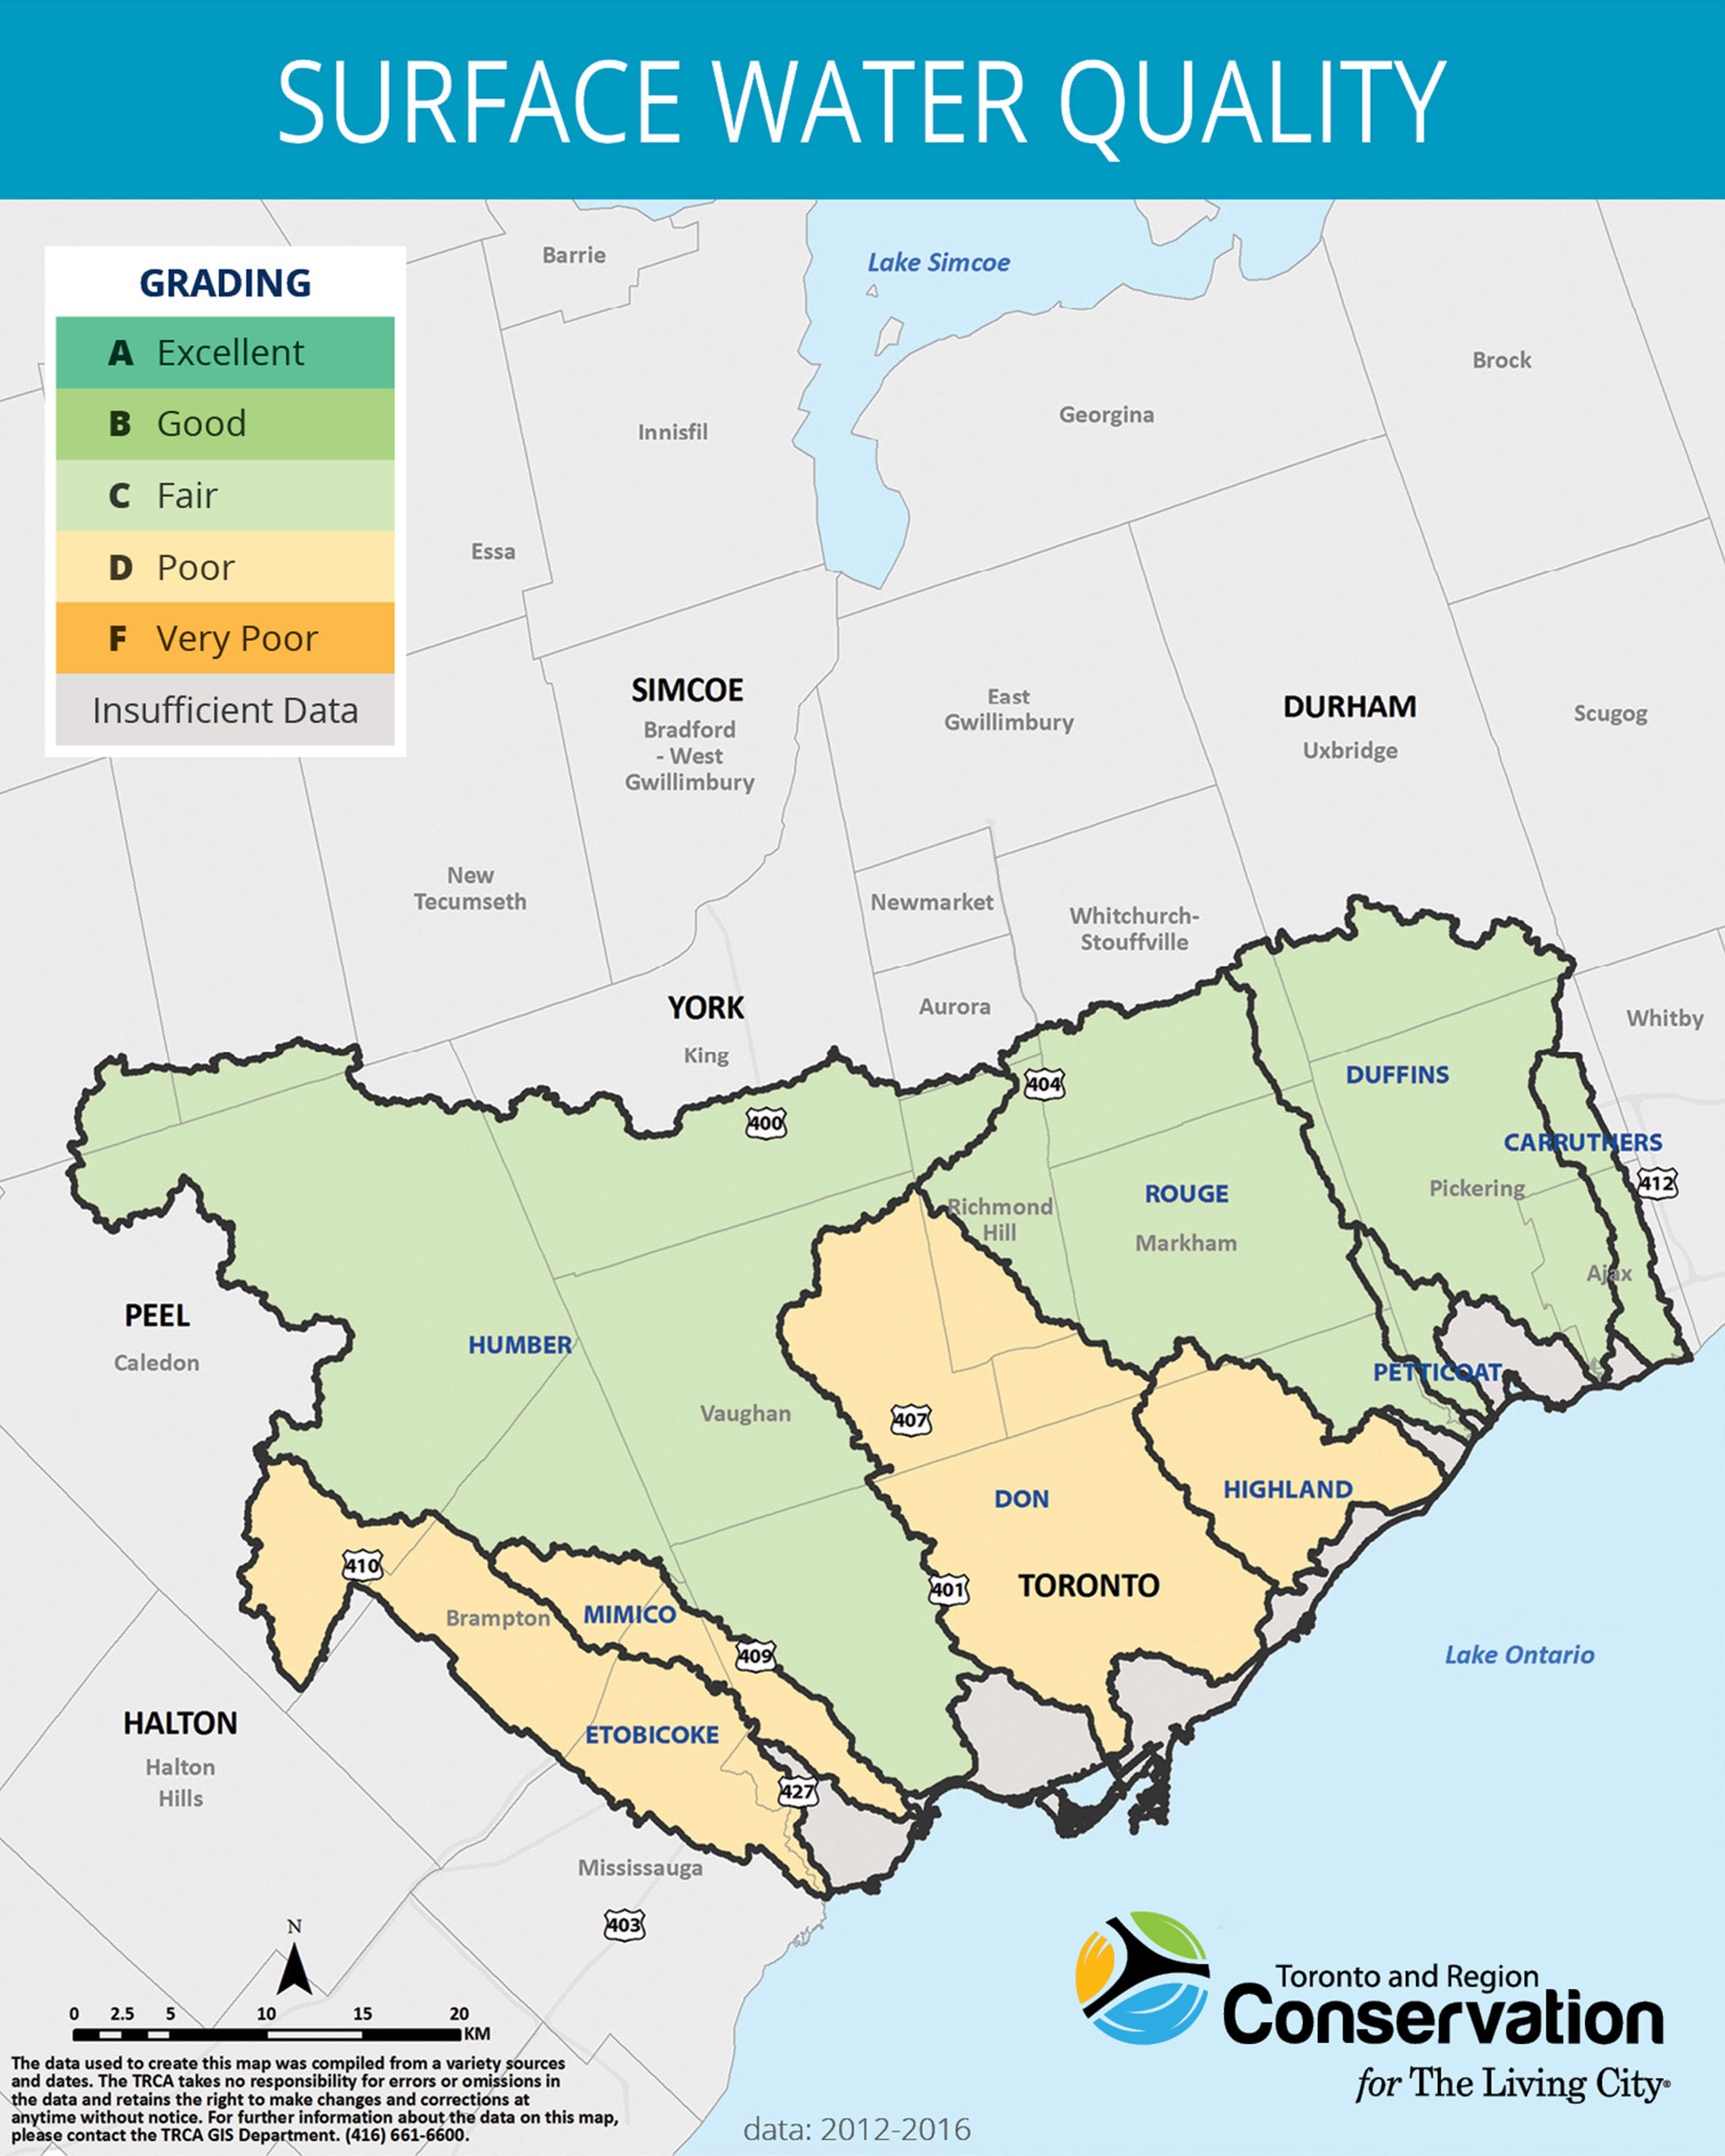
Similar to the information presented in the report cards, TRCA long-term data findings describe ‘Poor’ ecological conditions in some sections of our regional watersheds. In some of the more urbanized watersheds, we know that inadequate stormwater infrastructure and urbanization are contributing contaminants and sediment directly into our regional streams, degrading aquatic habitat conditions and increasing water temperatures. These factors are causing a decline in biodiversity, and affecting fish species such as the federally endangered Redside Dace and sensitive Brook Trout.
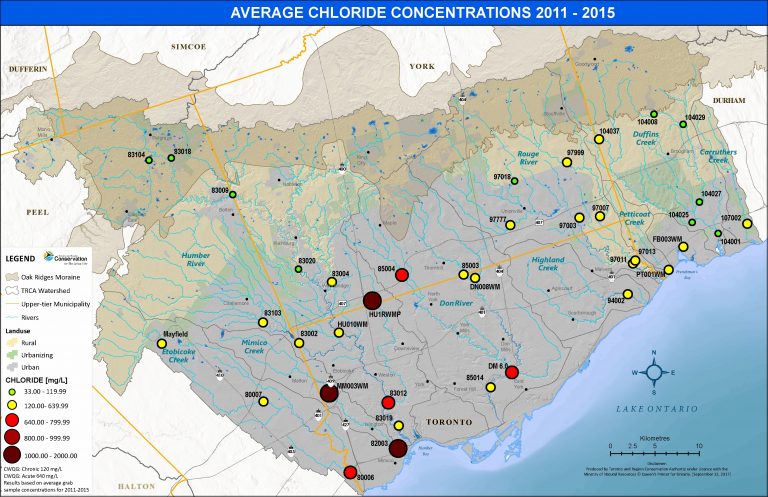
Between 2011 and 2015, 7 of 43 water quality stations had average chloride concentrations above the Canadian Water Quality Guideline for acute effects. This guideline is set because streams with concentrations surpassing this threshold are likely to be lethal to aquatic life at some point. Mimico Creek watershed had the highest concentrations compared to other watersheds.
View Recent Surface Water Quality Reports
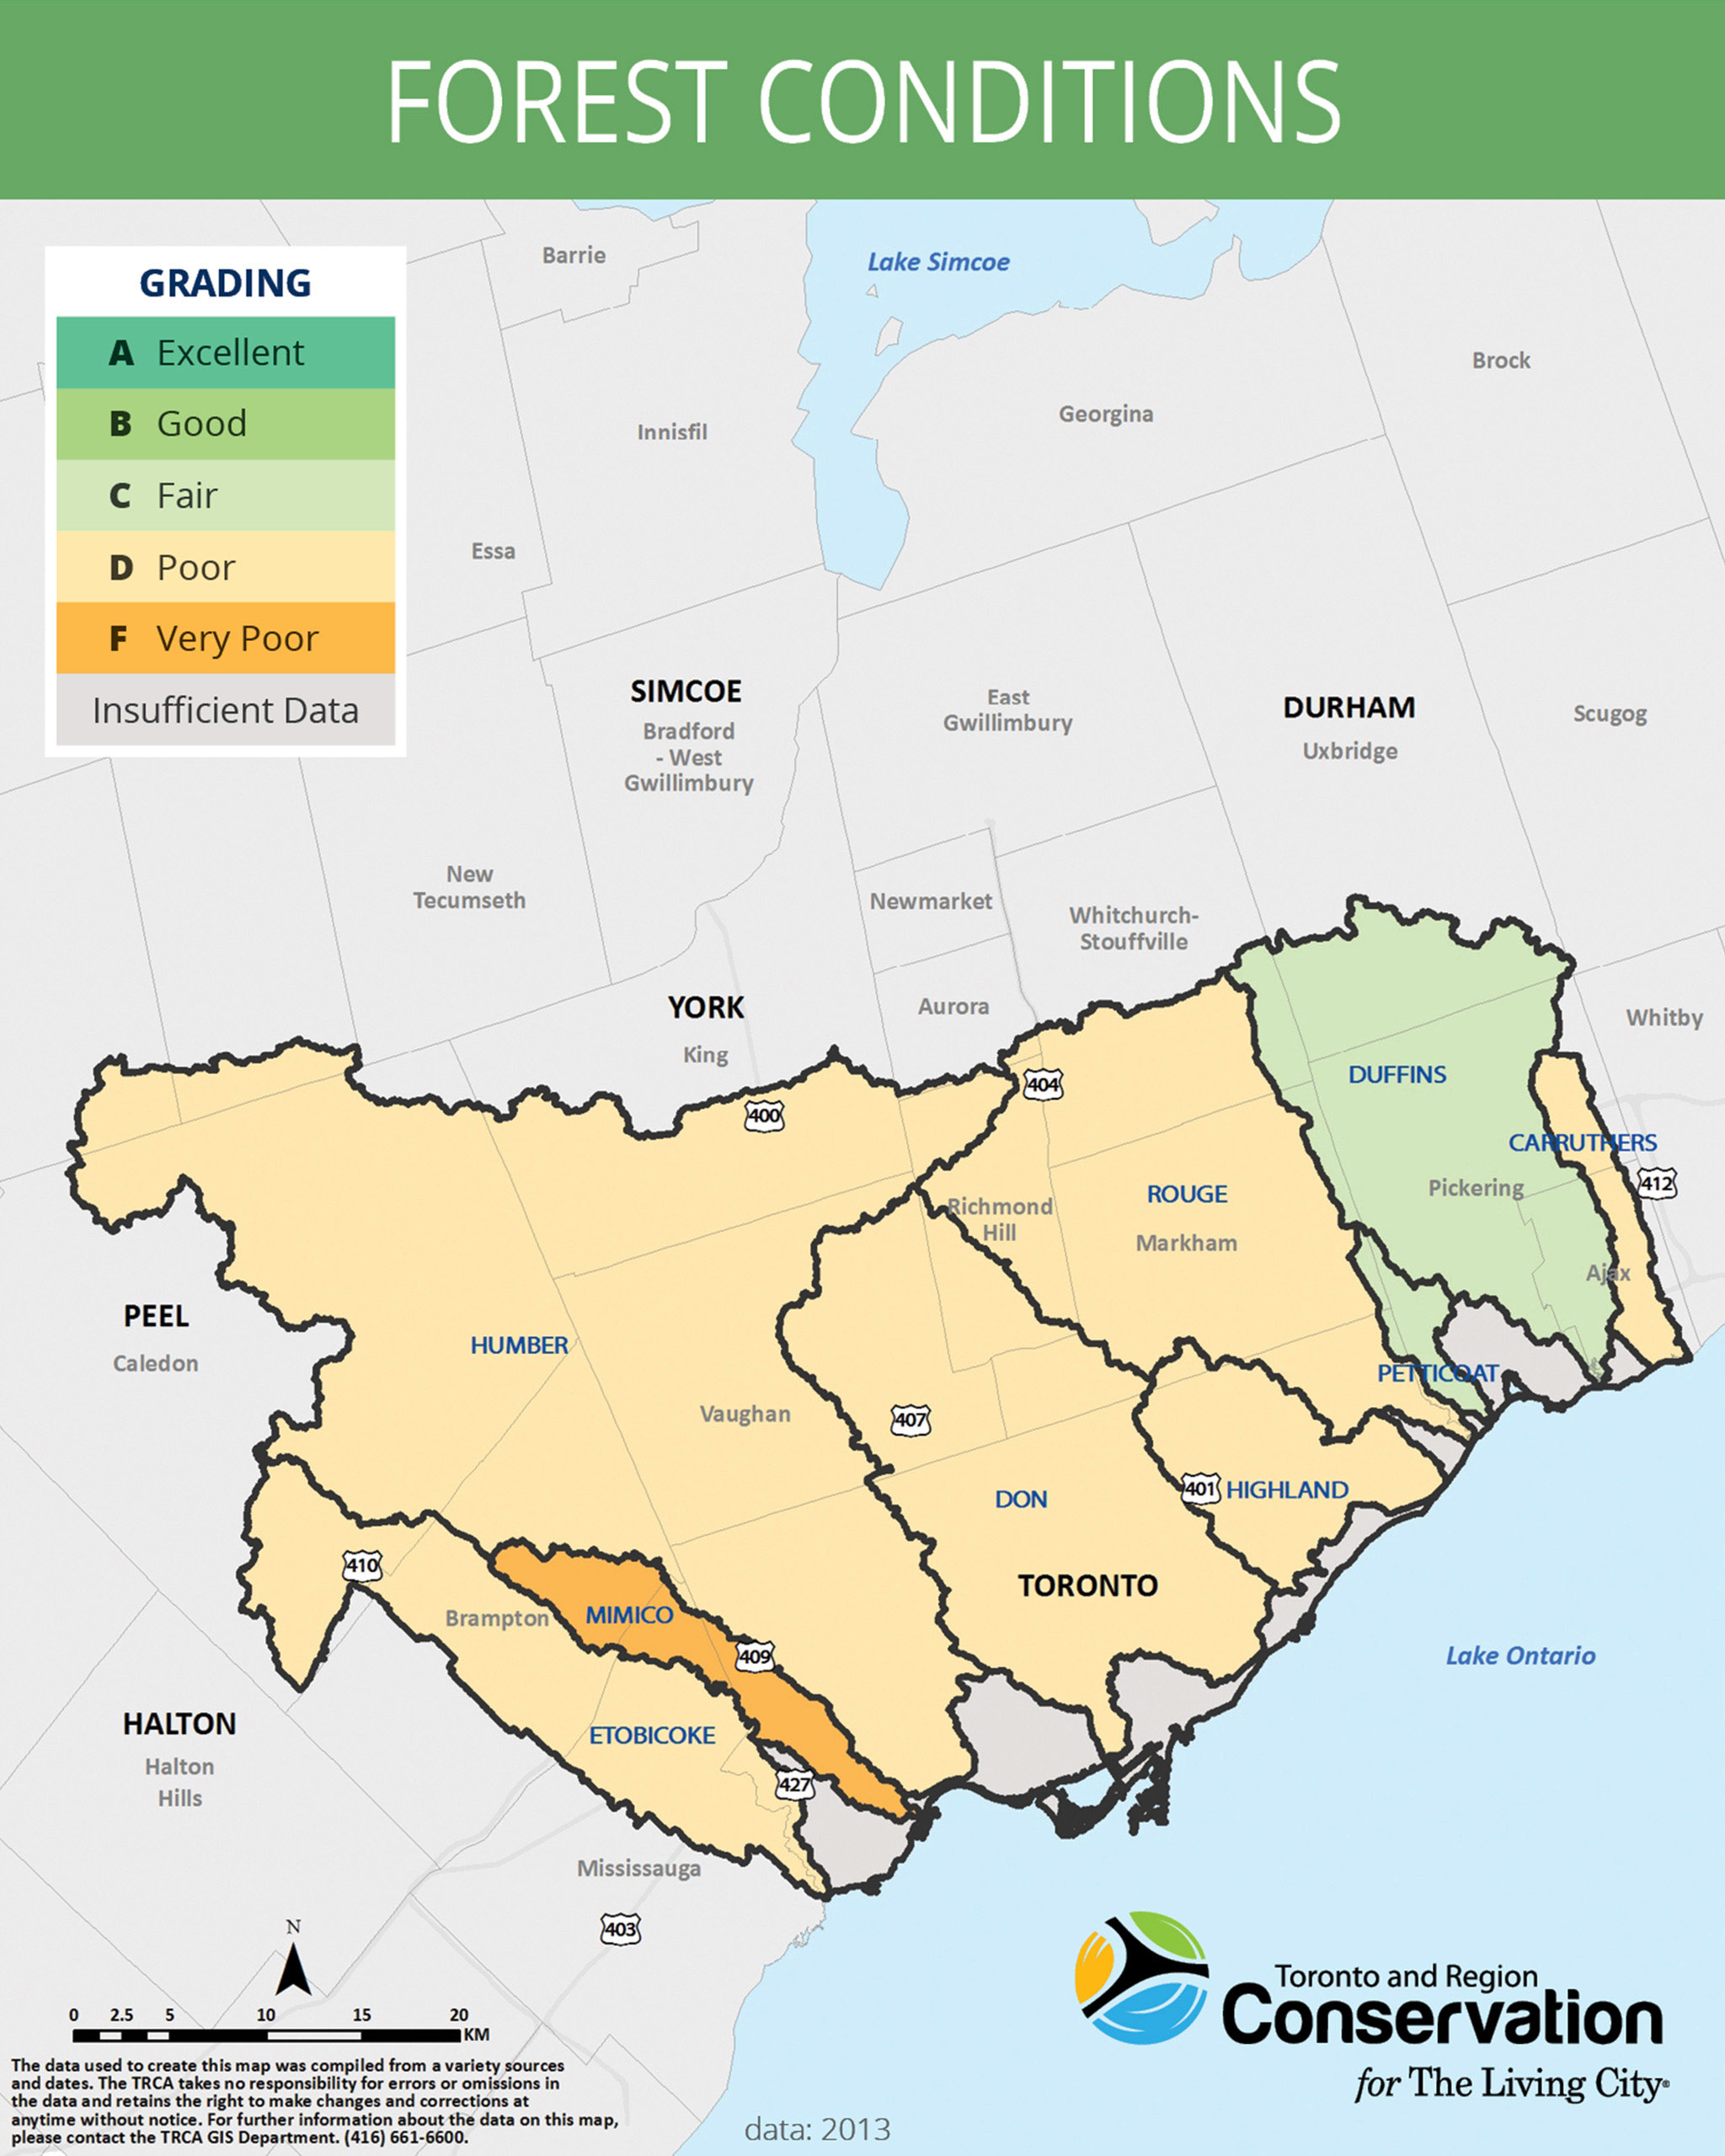
We also know from our data that in some areas within our watersheds, the quality of regional forests are degraded due to habitat fragmentation from urbanization and impacts from surrounding land use activities. Furthermore, our data show that increased recreation (such as unofficial trails and off-leash dogs) in some of the more high-quality pockets of forest areas are contributing to the introduction of invasive species and negatively affecting the breeding activity of regional birds and amphibians.
But There’s Good News, Too!
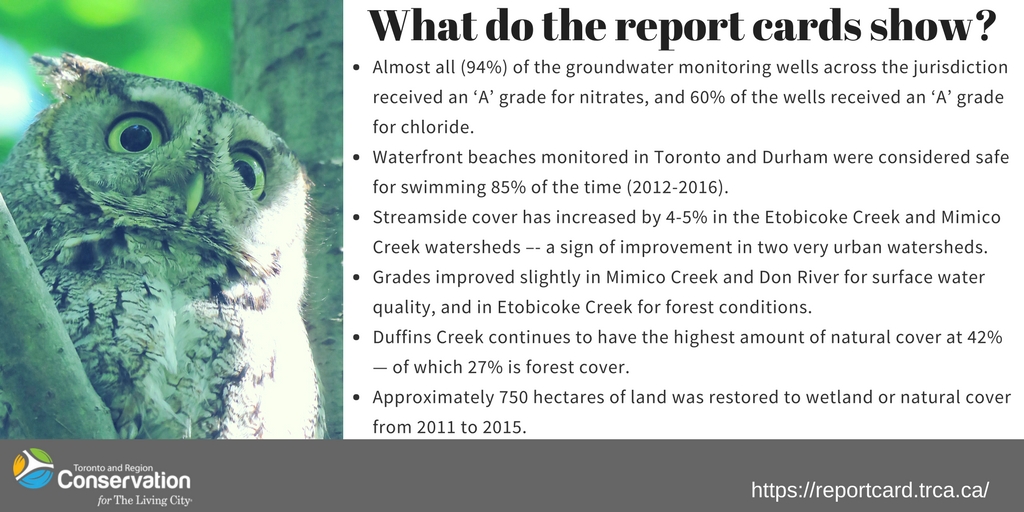
Despite these challenges, the hard work of TRCA and its partners over the last few decades has resulted in positive change. For example, the report cards discuss how approximately 750 hectares of land in the Toronto region was restored to wetland or natural cover from 2011 to 2015. Streamside cover has increased by 4-5% in the Etobicoke Creek and Mimico Creek watersheds over the last five years –- a sign of improvement in two very urban watersheds. Furthermore, grades have improved slightly in Mimico Creek and Don River for surface water quality, and in Etobicoke Creek for forest conditions.
TRCA fisheries data from almost 500 locations on the Toronto area waterfront also show that the abundance of fish found remains steady, while pollution-tolerant fish species are less abundant overall. What these findings indicate is that many of the waterfront habitat creation and restoration projects undertaken by many partners over the last couple of decades are helping fish communities.
There is no question that we have more to do in the conservation arena — but these successes give us hope.
Monitoring Matters
The Report Cards highlight the state of the environment in our local watersheds; they are based on the idea that regularly measuring where we are helps us understand how to improve our programming to achieve our goals. This is where the commitment to monitoring matters!
It will take time and resources to track progress made and set conservation targets. We need to especially continue to pay attention to the specific locations where conditions are improving. TRCA will continue to dedicate resources to long-term monitoring, as well as invest in new conservation lands, the management of existing lands, and restoring wild spaces.
All of these combined actions will continue to add to the positive changes occurring in the regional watersheds and waterfront areas.
Where Can I Get More Information?
Check out TRCA’s 2018 watershed report cards. You can view report cards from other conservation authorities HERE.
Through scientific data collection, TRCA’s Environmental Monitoring and Data Management team tell the stories about the changes affecting the natural areas and watercourses within our regions. For more information, please visit our webpage, follow us on Twitter, subscribe to our Monitoring Matters e-newsletter, or visit our YouTube playlist.
VIEW THE TRCA MONITORING TEAM’S 2017 PROGRESS REPORT